Introduction:
Please see the interpolation part one discussion, as it contains some of the basic information this tutorial will build on.
The previous discussion on interpolation talked about how LuckGrib creates a high quality smooth interpolation for each GRIB record that it displays. This smooth interpolation is one of the essential steps that allows LuckGrib to present high quality graphics.
The previous discussion focused on contour generation. This discussion will focus on wind.
GRIB representation of wind:
Many GRIB parameters are represented by a single GRIB record. For example,
mean sea level pressure is represented by a single record with the name PRMSL.
Wind gust speed, rainfall, cloud cover - all are represented by a single
record.
Wind is an example of a parameter that requires two GRIB records. There are two ways that a GRIB model can represent wind:
- the most common method is to represent wind as a vector using the
UGRDandVGRDparameters. This vector describes both the direction and speed of the wind. The speed is found by calculating the magnitude (length) of the vector defined in the file - a less common method, found in some GRIB files, is as two parameters:
WDIR, which describes the winds direction (in degrees, with 0 being North) along with a second parameter:WIND, which describes the winds strength
Most GRIB files use the first method to represent wind - the files describe wind as a vector defined at each point.
Vector interpolation
Math is wonderful. The techniques for adding two vectors, subtracting one vector from another, and so many other geometric operations are very well defined, and once understood, often quite beautiful.
Consider a simple vector interpolation problem:
You are provided with two vectors, A and B. These two vectors are perpendicular to each other - one points directly North and one points directly East. The magnitudes of these two vectors are equal, they both have a length of 10 - representing a wind speed of 10 knots.
The problem is: calculate a vector, C, which is an even mixture (an average) of these two vectors
This is roughly the problem that GRIB viewing applications are required to solve. Obviously, rather than the average, the applications need to be able to generate interpolations (mixtures) for any proportion of the two vectors. (GRIB viewers actually need to deal with at least four vectors when interpolating, not two, but two is easier for the purposes of illustration.)
The average of two numbers is simply:
average (A, B) = (A + B) / 2
You could use this same formula to find the average of two vectors.
After reading the problem statement above, its clear that the resulting vector is going to be pointing NorthEast - the average of North and East.
The important question is: what is the resulting vectors magnitude?
Remember, in the case where the vector represents wind, the magnitude is the wind speed. The question of what the magnitude should be relates directly to what the GRIB viewer is going to report to you what the wind speed is at that point.
Since each of the two initial vectors have a magnitude of 10 (the wind speed is 10 knots,) you would expect that the resulting vector also have this same magnitude…right?
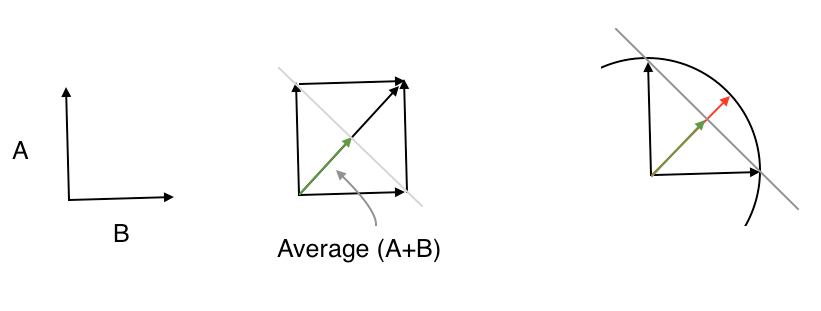
- The vectors on the left are the two vectors from the problem.
- The picture in the middle shows the two vectors being averaged:
(A + B) / 2. The green arrow is this average - The picture on the right shows A, B and the averaged (green) vector as well as the vector you would expect to see - the red vector is in the NorthEast direction, but has the proper magnitude - the magnitude you would expect
In this case, when the two vectors meet at a 90° angle, the magnitude of the green vector, its length, is 7. This is 30% less than the proper value. i.e. the simple average of these two winds, each 10 knots, results in a wind speed which is only 7 knots.
The main issue being raised here is that the math behind interpolating two vectors to yield a direction is pretty simple and straightforward. Everybody is going to get the direction right (NorthEast in this case.) However, the magnitude of the resulting vector is not as well defined - application developers have a choice to make regarding this aspect of the calculation.
Lets look at an example.
Interpolating Wind:
Two results are presented, one from LuckGrib and one from zyGrib. Once again, zyGrib is used in this example as it is available to the author. I believe the problems discussed in this example may be widespread.
If you would like to test the data from this example in a GRIB viewer of your own choice, its the same file as is used in the previous example. Please see that article for a link to it.
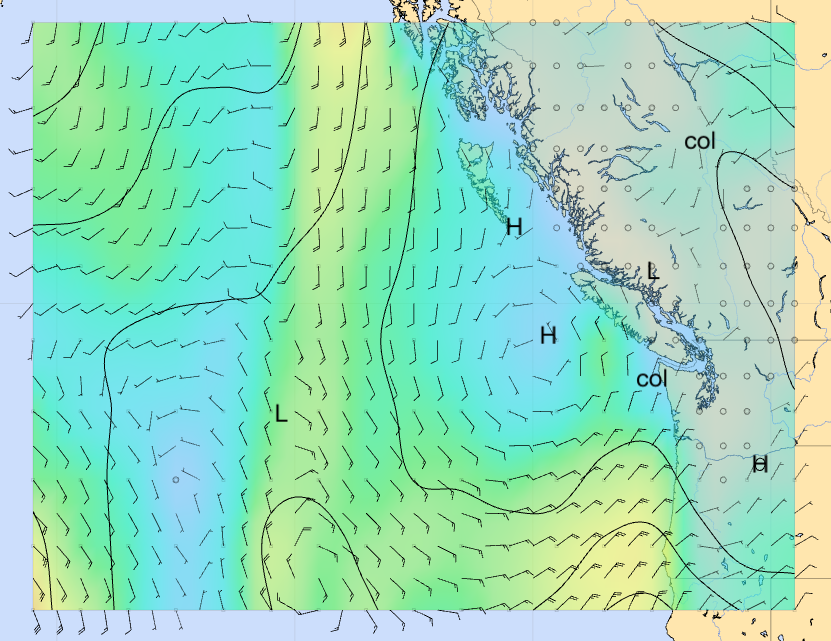
The LuckGrib wind example.
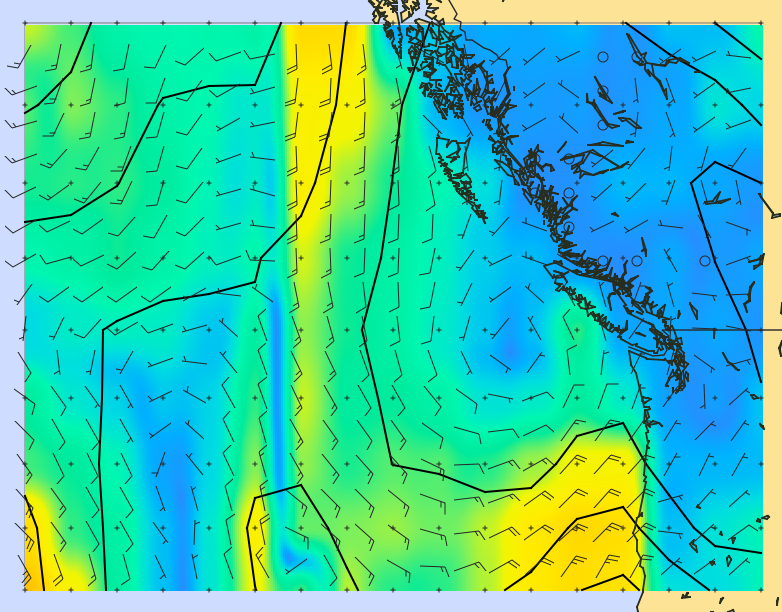
The zyGrib wind example.
An attempt has been made to match the colors and other attributes in these two images, so that they look as close to each other as is possible.
The portion of the two images I wish to focus on, is the wind speed in the front:
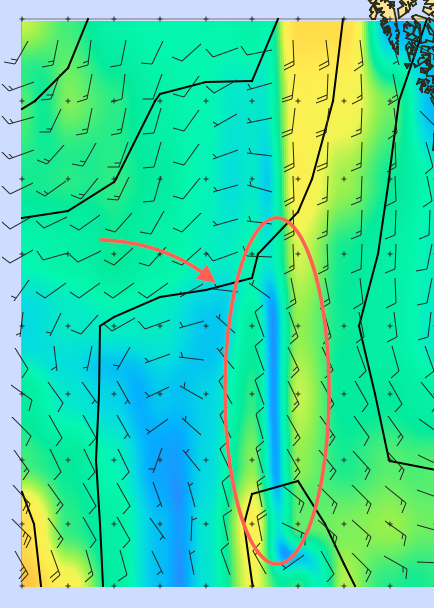
The two images, largely, represent the same approximate information except for the region close to the front. zyGrib is reporting that the wind speed in that area is very light, while LuckGrib is reporting that the wind is somewhere between 10 and 15 knots.
What’s going on here? Why the difference?
This is a perfect example of how two applications have made different choices in how to implement vector interpolation.
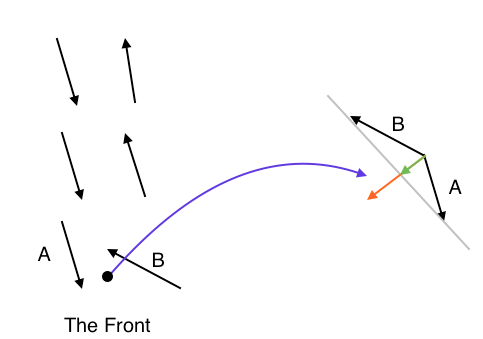
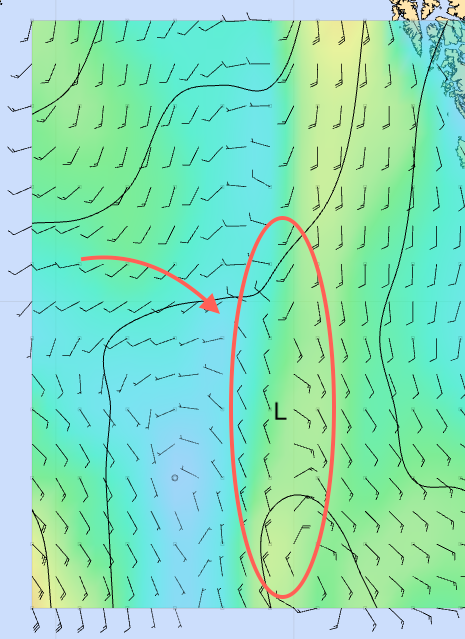
On the left hand side is a representation of the winds along the front. In this example, the vector at the dot is being calculated on the right. The green arrow is the simple average while the red vector properly accounts for magnitude. Note how short the green arrow is.
LuckGrib ensures that the vector interpolation it performs properly accounts for the vector magnitude. If it is interpolating between two vectors, and they each have the same magnitude, then the resulting vector will also have this same magnitude. In the vector interpolation picture above, LuckGrib is yielding the red vector - the correct answer.
zyGrib, and I believe many other GRIB viewers, is not properly accounting for the vector magnitude - it is yielding the green vector from the image above. The green vector has the proper direction - but the wrong magnitude.
Again, the two images of the region in question:
In the image on the right, the light winds being reported in the front are purely an artifact of the implementation - its due to the technique used in the vector interpolation. The GRIB model is not reporting those light winds, the light wind being reported is the result of the math used in the implementation of the GRIB viewer.
The image on the left is correct, in my humble opinion. The image on the right is misleading.
How big can this problem be?
For purposes of this discussion, the two techniques for interpolating vectors will be:
- simple. This is the simple, but incorrect, technique which yields the wrong magnitude. I believe there are many GRIB viewers which adopt this approach
- correct. This is the more complex technique which yields the proper answer. This is what LuckGrib does
In areas where the wind is flowing all in roughly the same direction, the simple technique for calculating a vector interpolation will yield a value very close to the correct technique. As the angle between the two vectors starts to diverge more and more, the simple technique starts to report answers which have increasingly wrong magnitudes.
This is mainly an issue in areas of disturbed wind flow, when the computer model is reporting wind directions that are quite different from each other at points close in a GRIB file - around fronts and other weather features.
A table showing the amount of error, assuming both vectors have the same magnitude:
| Degrees | Error % |
|---|---|
| 0 | 0.0 |
| 30 | 3.4 |
| 45 | 7.6 |
| 60 | 13.4 |
| 90 | 29.3 |
| 120 | 50.0 |
| 135 | 61.7 |
| 150 | 74.1 |
| 180 | 100.0 |
Note that the error is less than 8% when the two vectors differ by up to 45°. The errors start to increase rapidly beyond around 60°. When the two vectors point in opposite directions, differing by 180° then the answer will be the zero length vector - which is completely wrong.
This is what is happening in the area of the front, above.
If you are using a GRIB viewer which uses the (incorrect) simple technique, it could be seriously underestimating the winds you will be sailing in. By contrast, the complex technique will report very accurate interpolations of the wind speeds that are in the file.
Looking at the comparison images for LuckGrib and the other GRIB viewers, you may think that most of the wind speeds being reported appear to be pretty close. Its only in a small region that they differ. However, when sailing a long passage we often do not have a lot of control over where we end up sailing - weather can move faster than our sailboats. When I am sailing in the area of one of these weather features, I want my GRIB viewer to be reporting as accurately as is possible. LuckGrib does that.
Summary:
The people who develop the computer models behind the GFS, CMC and all other weather models spend an incredible amount of effort in order that they produce as accurate a result as is possible. The computer models are by no means perfect, but a huge effort has gone into their creation, and the author of LuckGrib respects their effort.
LuckGrib continues where the weather model developers finish, in presenting the results of their work in an as accurate and informative manner as possible. The author has been careful in all areas of the development process - investing quite a lot more development effort than would otherwise have been needed in order to ensure that the results are an accurate portrayal of the weather model. No shortcuts are taken in this effort. Presenting the weather models, as represented by the GRIB files, accurately, is a priority for LuckGrib.