Note that there are two ASCAT models offered through LuckGrib. Their differences will be described a little later in this article. First though, what is the ASCAT model all about?
What are Wind Observations?
The purpose of the two ASCAT models is to provide timely ocean wind observations. ASCAT wind data can act as a source of truth for what the actual wind was at a time and location on the ocean.
There are several ways of obtaining actual wind observations around the planet:
There is a large network of surface weather stations that provide real time measurements of the wind, however these stations are mainly confined to land areas.
There is a sparse collection of buoys on the ocean which provide weather observations, however these buoys are largely concentrated in areas relatively close to shore. There are large areas of open ocean that do not have any buoy’s present, and finding wind observations for those areas can be difficult.
There is also a collection of surface observations possible through reports that vessels at sea create which describe the conditions they are experiencing. These reports are sparse, and often restricted to the major shipping routes. Offshore sailors can find themselves in areas which do not have ship reports nearby.
Satellite wind observations. These wind observations provide global coverage, with areas providing updated observations on a periodic basis. As the satellites orbit the earth and send their data, their coverage is updated, swath by swath.
Note that the first three observation methods above provide data at a point, while the satellite observations provide wind information across wider areas.
LuckGrib offers access to satellite wind observations through its two ASCAT GRIB models:
What is ASCAT?
There are two satellites orbiting the earth, generating ASCAT data:
 https://www-cdn.eumetsat.int/files/2020-08/ASCAT_two_550_km-wide_swaths_ESA.jpg
The following description has been taken directly from the NOAA Office of Satellite and Product Operations (OSPO) product page:
The Advanced Scatterometer (ASCAT) winds products are processed by NOAA/NESDIS utilizing measurements from the scatterometer instrument aboard the EUMETSAT Metop satellites. The instrument uses radar to measure backscatter to determine speed and direction of winds over the surface of the oceans. …
ASCAT wind data provides statellite observations of winds at the ocean surface.
Why use ASCAT data?
The ASCAT data are observations, not forecasts. ASCAT provides a source of truth for the actual ocean winds.
The main purpose of this model is to compare its wind data to surface wind forecasts, to evaluate their accuracy. If a forecast compares well with the ASCAT data, then that forecast was skillful. Where a forecast and the ASCAT data differ, the ASCAT data should be trusted.
As the ASCAT data is based on actual observations, it is always historic. By the time we have access to the data, it records something that happened in the past. This is also true of the 0H forecast data in a global weather model. The 0H forecast is always historic with respect to when the forecast data becomes available. Comparing the 0H forecast winds to ASCAT winds may provide insight into how well the forecast may perform.
LuckGrib ASCAT models.
There were many alternatives available in deciding how to present the ASCAT data in GRIB form. This section, and the next are meant to explain some of those choices.
After a long series of experiments, it was decided to present the ASCAT data in two forms. The first model, the Latest variant, will likely be the one most useful to everyone. The second model, the Orbits variant, is most useful when studying the ASCAT data itself and understanding what it is presenting. The Orbits variant may also be more useful for people verifying older forecast data, as it contains additional (historic) information.
Here are two samples from the ASCAT models:
ASCAT Latest (most recent 12 hrs.) This model will be most useful to sailors, especially sailors at sea. This model contains a single GRIB record containing the most recent 12 hours of ASCAT satellite data.
ASCAT Orbits. This model contains up to around two days of data, with the data broken up into approximately 6 hour chunks, with each chunk (GRIB record) centered on a synoptic time (00Z, 06Z, 12Z and 18Z.)
The ASCAT Latest model may be easier to use than the Orbits version, while also being a smaller GRIB download, as it only contains a single time step. For example, pretty much the entire Pacific can be downloaded using the Latest version of the model, at 0.5° resolution, in around 24KB. The Orbits version of the model, requires around 140KB for the same region and resolution, due to having 2 days of data.
The much reduced file size for the Latest version means that it can be easily downloaded at sea while using slow satellite devices. This makes it much more useful for sailors. Also note that the 24KB referred to above was reduced to 12KB when delivered through the LuckGrib Offshore Data system (with its additional compression.)
LuckGrib ASCAT data.
Each of the two ASCAT satellites are in a sun-synchronous orbit. Here is an example of the data from a single orbit from an ASCAT satellite:
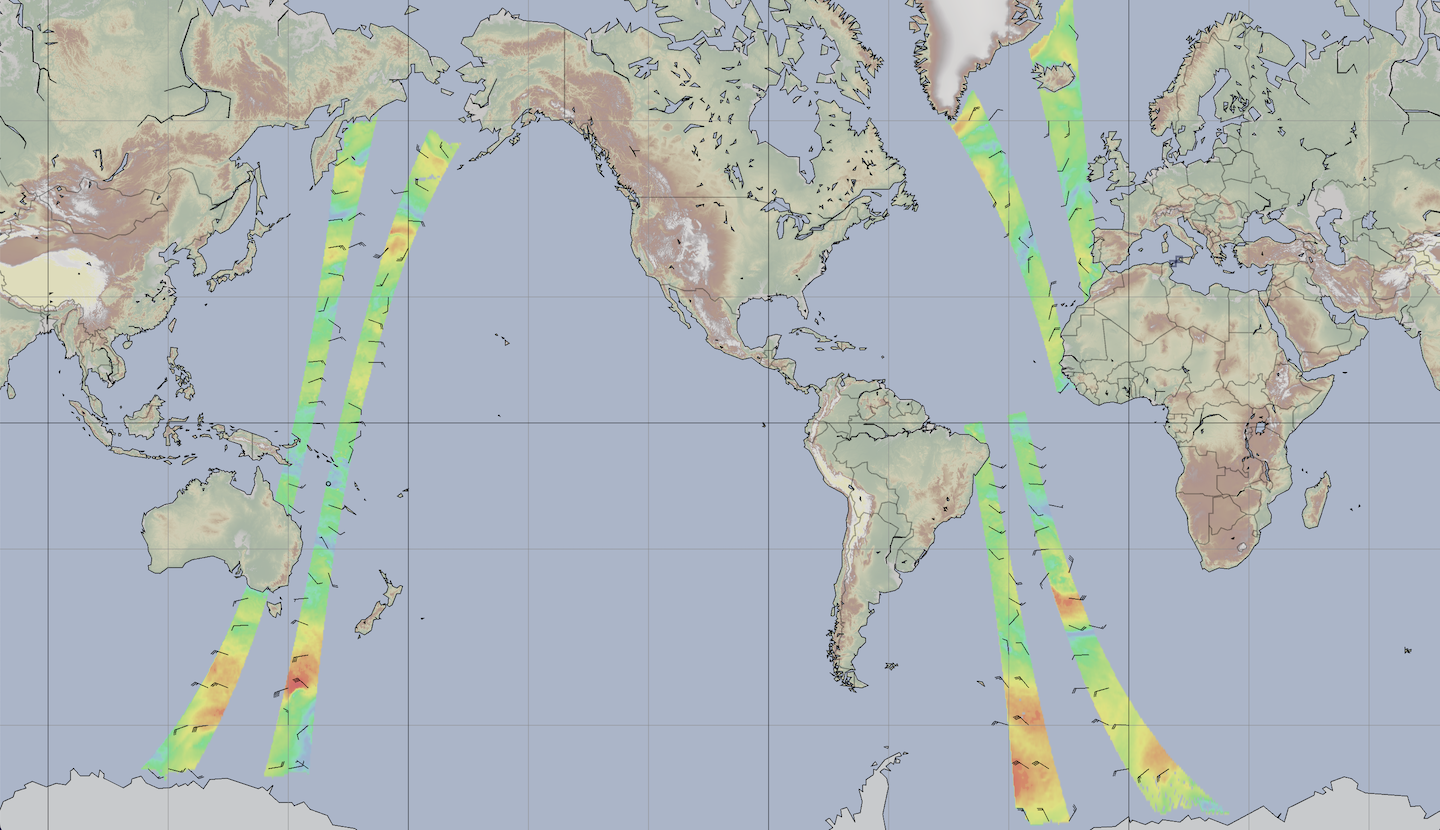 A single ASCAT orbit.
This data starts around north western Africa. That is the earliest (oldest) data in this image. The satellite then heads north to the pole on an ascending path. After crossing the north pole, the satellite descends and passes through the Bering Sea on its path to the south pole, and then heads north to the equator again.
The reason for the slant in the data swaths is that the earth is rotating beneath the satellite. After a little study, you can recognize which data is from an ascending or descending swath by its orientation. Each orbit takes roughly 1hr 41min.
Note that with most GRIB data, a GRIB record contains data for a single forecast time. In the image above, the time at each point is different, reflecting the time the satellite was orbiting above that area. LuckGrib makes it easy to determine the exact time for each sample, through the text information displayed by the app.
Time at each sample
The ASCAT models provide wind information along with the time at each sample. In particular, they provide the number of seconds prior to the reference time. This value can be both positive or negative, with a negative value indicating the number of seconds after the reference time. Using this time information, as you move your cursor around, LuckGrib can present the observation time for each point. This timing information is important when you are using this data to compare it to forecast data.
Depending on how your area of interest coincides with the satellite orbit times, there may, or may not be recent ASCAT wind data available.
Each area in the world has an opportunity for a new update of data roughly every 24 hours, with a close by area being updated approximately every 12 hours. While there are two ASCAT satellites, they are closely aligned with each other, as they are each in the same sun synchronous orbit, approximately 180 degrees out of phase.
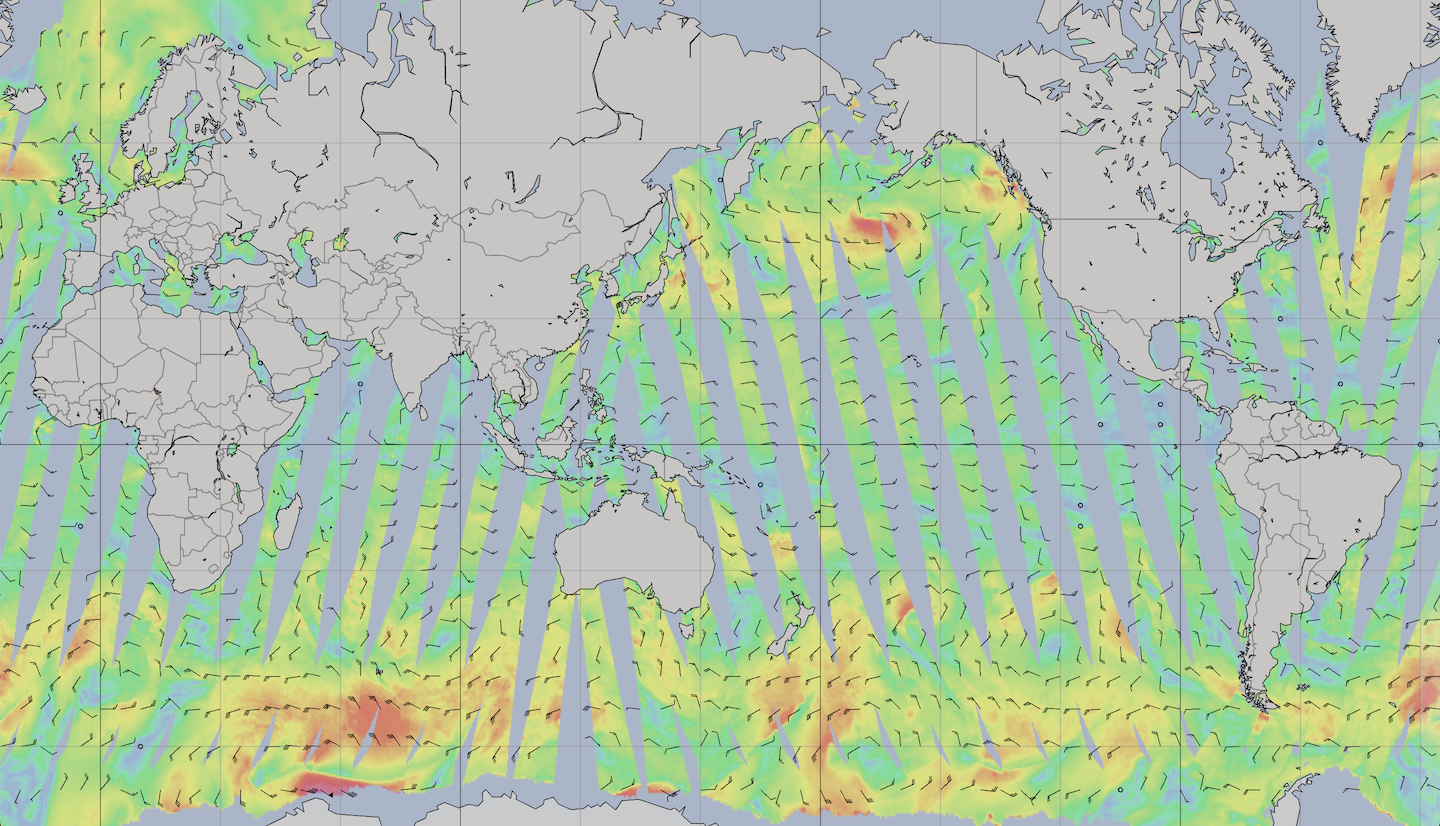
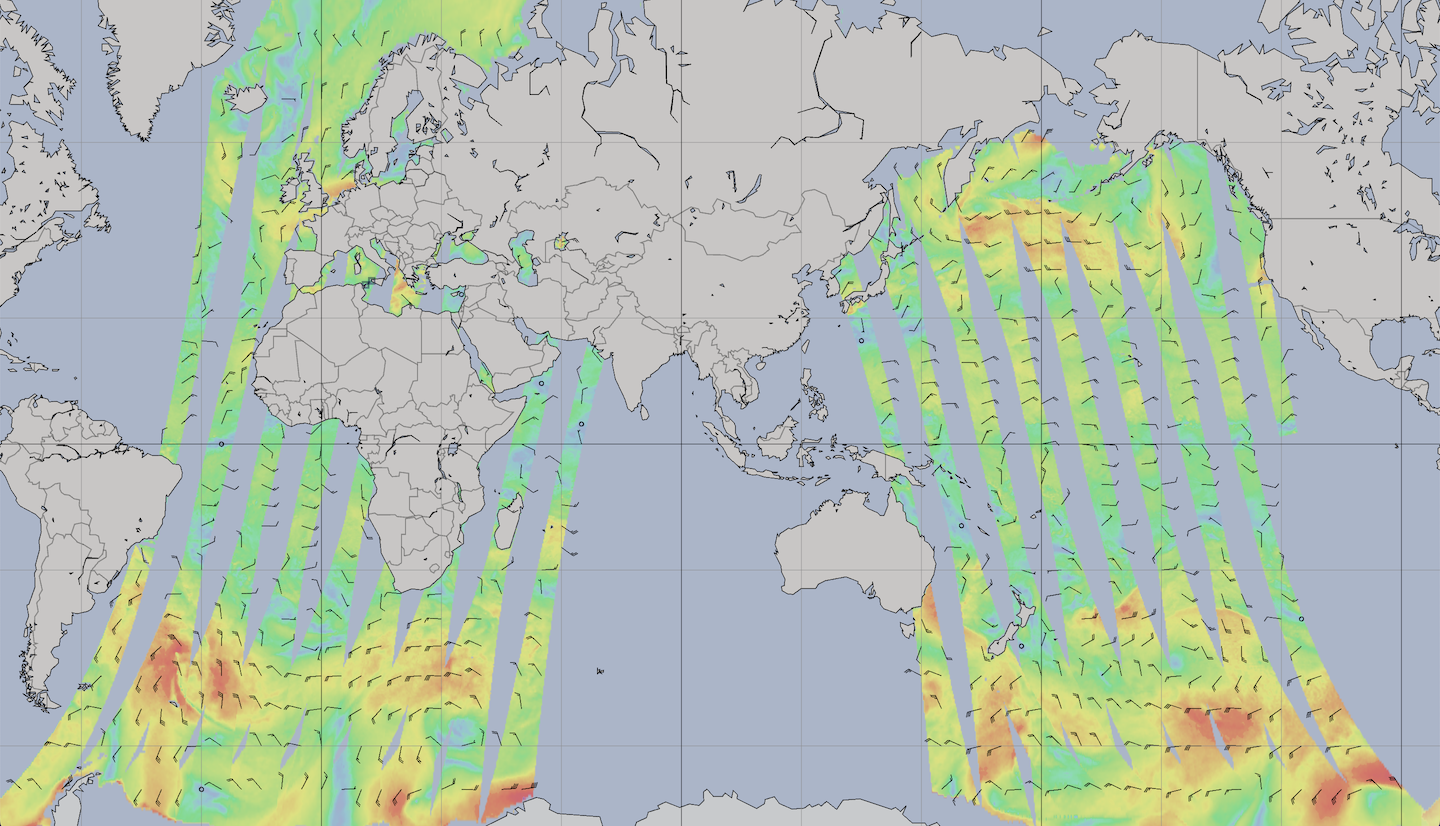
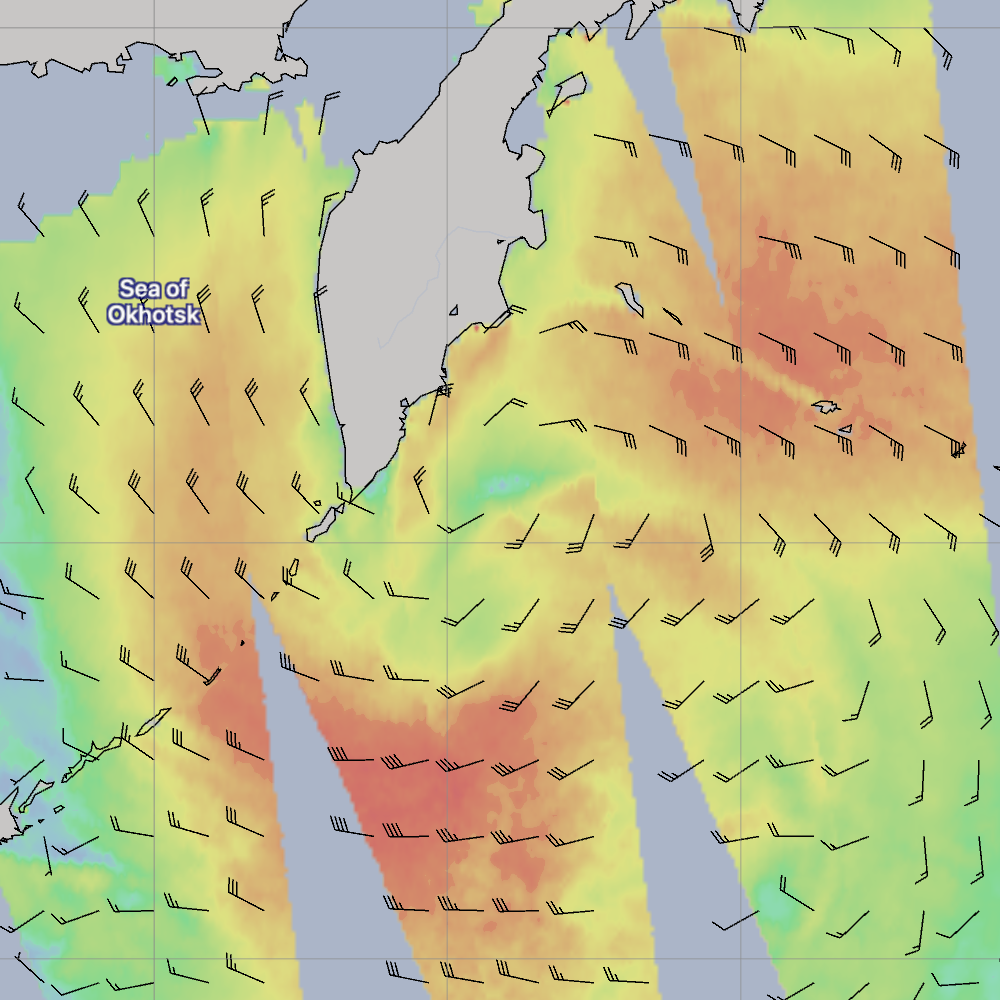
Its possible to view a visual representation of the time contained in the ASCAT data. For example:
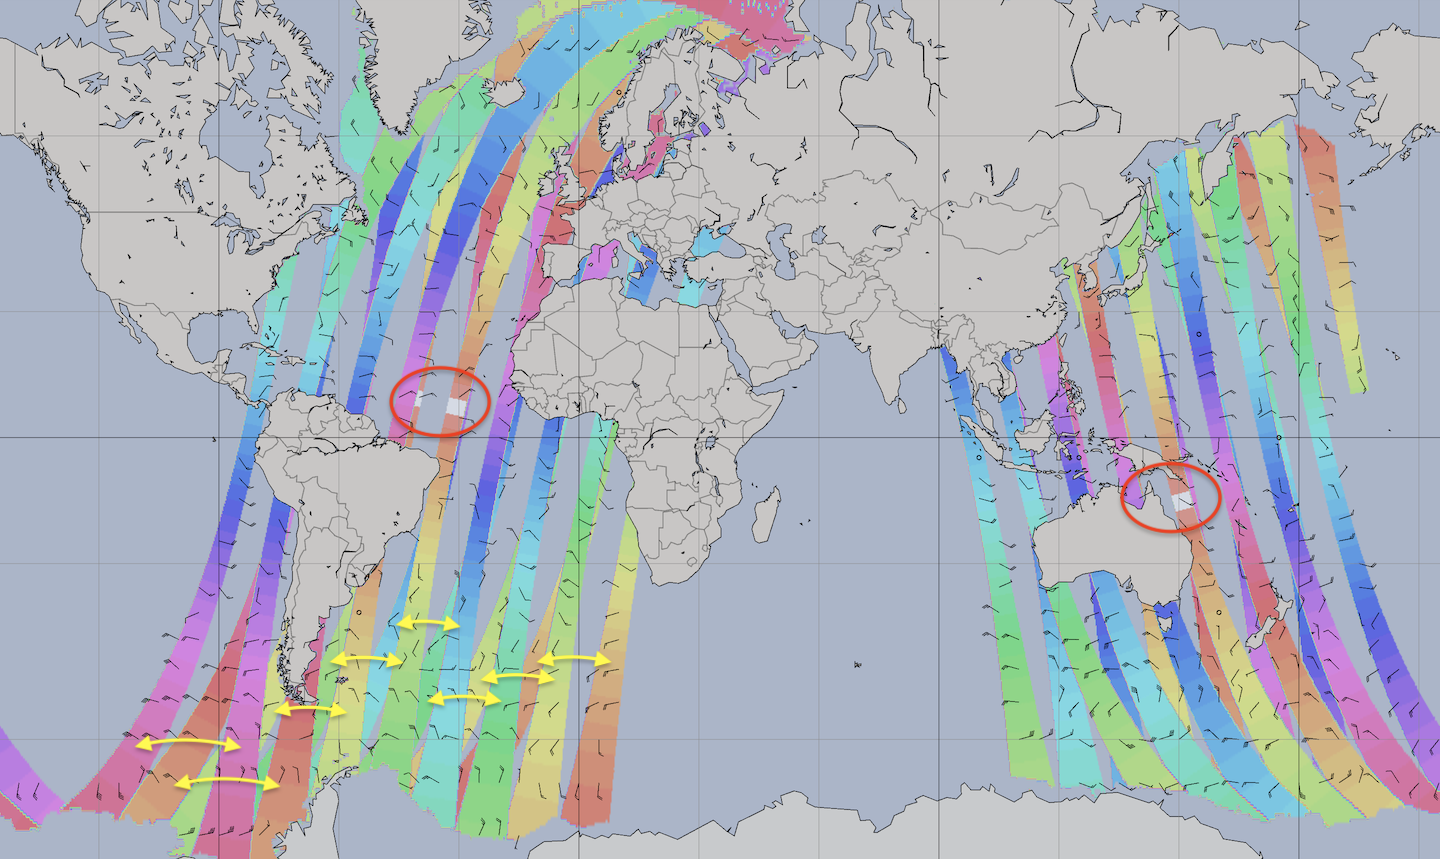 A visual indication of the sample times.
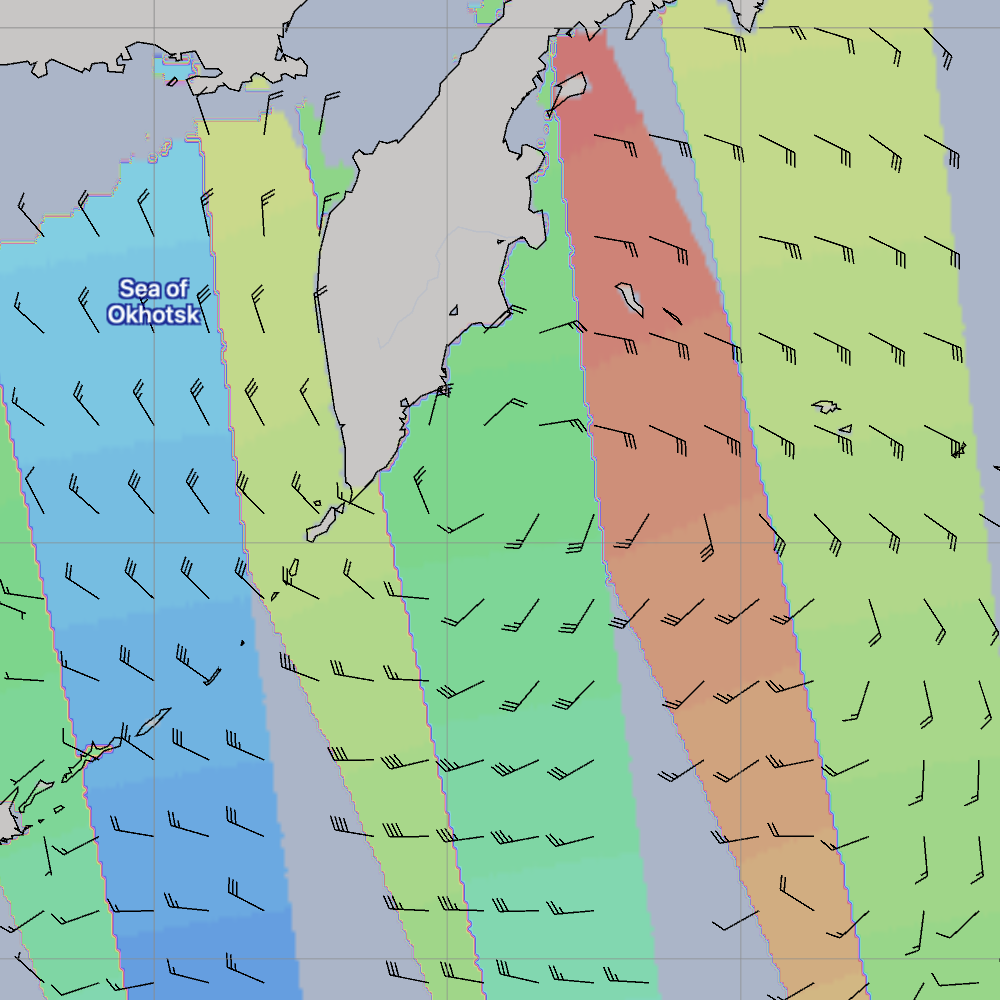
There are a number of points which can be made about these three images:
Note that their appear to be many overlapping areas of data. LuckGrib always shows the newest data available for each point. So where two data swaths overlap, the newest data will appear on top.
When viewing ASCAT time as a color, aside from the white blocks, there is no particular meaning to the colors - red is no better or worse than green, blue, etc. The time color image can be used to identify edges of ASCAT swaths. Time will vary slowly along a swath, following the orbit of the satellite.
Recall that each pass of the satellites generates two swaths of data. The time visualization can help identify which pairs of swaths come from the same satellite pass. The yellow arrows in the first image above shows the swath pairings you can see in this data.
Notice that there are two circled white blocks in the first image above. These white blocks indicate that the seconds prior to reference time value is close to zero, indicating that these are the locations of the two satellites at the GRIB records reference time. With a little thought, you should be able to now imagine the two satellites orbiting the earth, on the same general orbit, but where each satellite is at near opposite sides of the earth (i.e. close to 180 degrees out of phase.)
Also, note that when working with this data, as you examine wind values in an area that you may move from one swath to an adjacent one, the valid time may jump by up to several hours. For example, in the pair of images above, this area of the ASCAT image contains many overlapping swaths, as shown by all the different time value colors. In this case, the wind strength color image looks fairly uniform across the swath edges. If you see a sudden change in wind strength in an area following the shape of a swath edge, you should note the times of the samples and interpret the data accordingly.
LuckGrib will display the valid time for each wind sample, as text, if and only if the GRIB time is exactly on one of the GRIB record times. When working with ASCAT data, you should ensure that as you alter the time in the app, that you use the app’s ability to move to the previous or next GRIB time (left / right arrow keys on Mac, central radial menu next / prev commands on iPhone and iPad.) When this is done, you will see an information display such as:

If you do not see the line showing the valid time then either the file does not contain the time parameter, or the current GRIB time is not placed exactly on one of the synoptic times.
When comparing forecast data to ASCAT observations, you should be aware of the time you are looking for, and the time at each ASCAT sample.
Timeliness of the data.
(The credits section below describes the cast of characters mentioned here.)
I believe the order of operations is something along the lines of:
- EUMETSAT / KNMI receives raw data from the satellites, processes it and delivers it in 3 minute chunks called granules. There is a lot of science magic accomplished in this step.
- PO.DAAC gathers these granules and combines them into orbits. A full orbit starts with the first granule that is ascending above the equator, and ends when the equator is encountered again. PO.DAAC makes these orbit files available quickly after its last granule arrives.
The two ASCAT models process the orbit data a little differently.
ASCAT Latest (most recent 12 hrs.) This model is updated hourly, incorporating the most recent, approximately, 12 hours of data.
ASCAT Orbits. When a new orbit file is available, LuckGrib downloads its content and processes the most recent (approx) two days of data into a fresh model run. This ASCAT model updates frequently, but on a somewhat irregular schedule, ranging from 40 minutes to a little over an hour. The updates occur quickly after the data is available.
Note on reliability of model updates.
The people at NOAA and NASA have different categories they assign to the data they produce. Operational data is high priority and a great effort is made to ensure that operational data is delivered on time, day after day. Non-operational data is delivered on a best effort basis. With non-operational data, there may be times when the data is not updated, sometimes for several days at a time.
The ASCAT data is considered non-operational. LuckGrib’s servers are frequently testing for new data availability, and as it becomes available it is processed and made available to you. If you experience a delay in this model updating, please be patient. As the source data is considered non-operational, these delays are to be expected from time to time.
Credits.
The primary source for the ASCAT data is EUMETSAT:
The Advanced SCATterometer (ASCAT) is one of the instruments carried on-board the Meteorological Operational (Metop) polar satellites launched by the European Space Agency (ESA) and operated by the EUropean organisation for the exploitation of METeorological SATellites (EUMETSAT).
– https://scatterometer.knmi.nl/publications/pdf/ASCAT_Product_Manual.pdf
The Royal Netherlands Meteorological Institute (KNMI) is involved in its processing:
KNMI is involved in the OSI SAF and the EUMETSAT Advanced Retransmission Service (EARS) ASCAT service as the centre where the Level 1b to Level 2 wind processing is carried out.
– https://scatterometer.knmi.nl/publications/pdf/ASCAT_Product_Manual.pdf
When reading material related to this data, you may come across references to EUMETSAT/OSI. OSI is the Ocean and Sea Ice department at EUMETSAT. There are also references to SAF/KNMI. SAF is the Satellite Application Facility at KNMI.
The raw ASCAT data is being obtained by LuckGrib through the Physical Oceanography Distributed Active Archive Center (PO.DAAC) at the Jet Propulsion Labratory (JPL).
The ASCAT data at PO.DAAC internally contains the following credit string: ‘EUMETSAT/OSI SAF/KNMI.’
PO.DAAC has the following data use policy:
Data hosted by the PO.DAAC is openly shared, without restriction, in accordance with NASA’s Earth Science program Data and Information Policy.
I would also like to thank David Burch, who, among many other things, is the author of Modern Marine Weather. Without David’s encouragement, this model would not have been made available through LuckGrib. If you enjoy using this data, some of the credit goes to David.