Update March 22, 2021: GFS has been upgraded to v16. This new version changes its PRMSL field so that it is no longer filtered. With this change, the LuckGrib servers are now downloading and delivering PRMSL data directly from the GFS. This MSLET to PRMSL conversion is no longer necessary.
I was recently watching Hurricane Lane approach Hawaii and was curious about what the GFS model was showing:
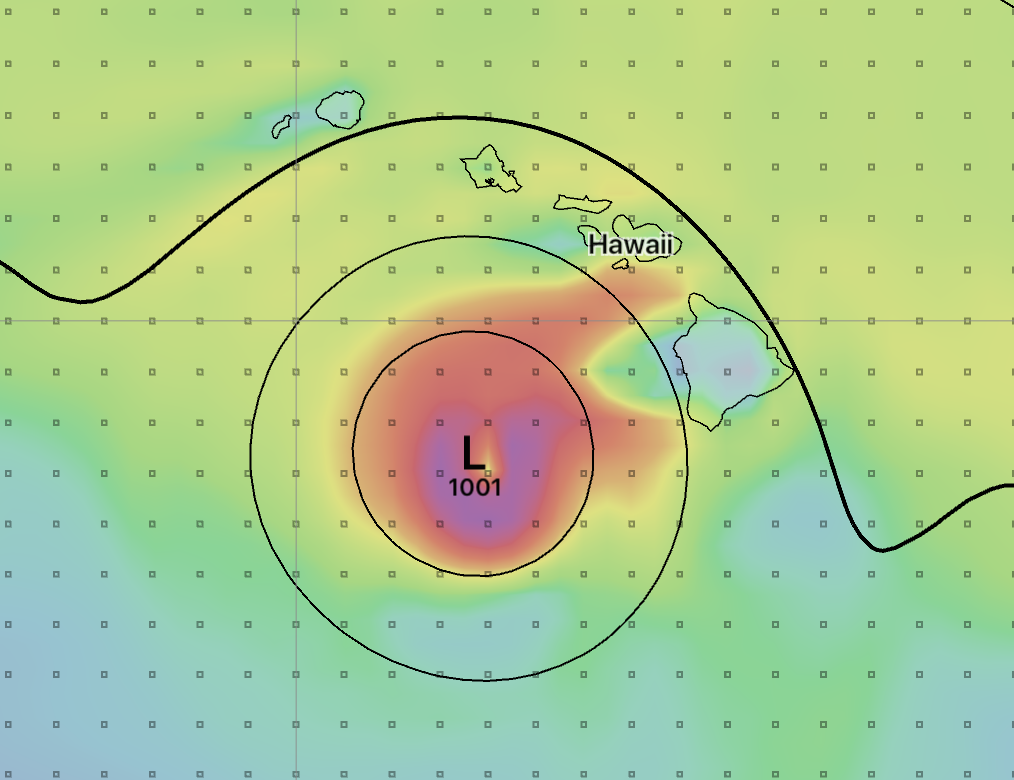
The maximum sustained winds shown in the image are around 72 knots. This is from GFS data on August 24, 2018 12 UTC.
How does a low at that location, with a central pressure of 1001 hPa generate those winds?
The answer is: it doesn’t. That’s simply not possible.
I realize that weather models aren’t perfect, but I was surprised that GFS was getting the pressure so wrong. The model was doing a decent job on wind speed and direction, including a nice wind shadow being shown in the lee of Mauna Loa. I asked myself, how can the model be doing so well with the surface wind but so badly with sea level pressure?
After a lot of digging I discovered that the GFS model has two parameters that represent sea level pressure: PRMSL and MSLET. I used LuckGrib to download data from NOAA for the MSLET parameter, and after a little customization to teach the app how to draw the pressure, this is what I saw:
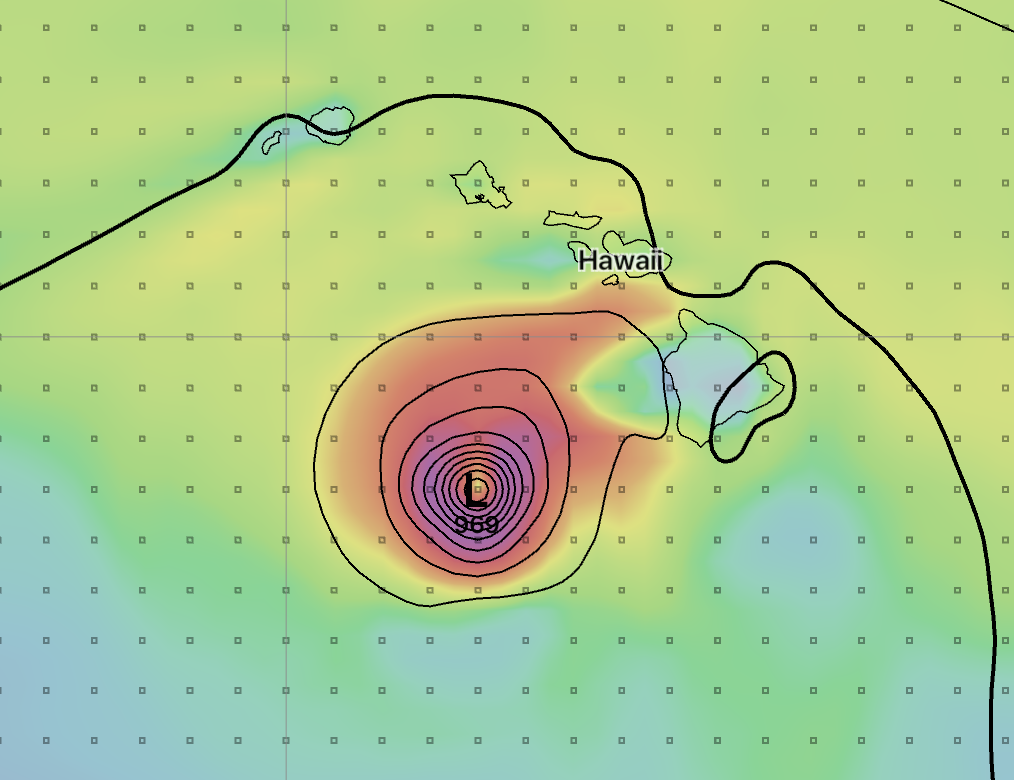
These two images are from the same model run, same location, same time - the only difference is the parameter being used to represent sea level pressure.
When using MSLET the central pressure falls from 1001 hPa to 969 hPa. The pressure field from MSLET is clearly a much better representation of reality.
To make a long story short, I have modified the GFS and FV3-GFS models so that from now on, when you ask for sea level pressure, you get MSLET and not PRMSL.
Very briefly: there is a lot of smoothing being applied to the PRMSL parameter and its effective resolution turns out to be around 150km. MSLET has the full resolution of the model.
With this change, everybody will now be receiving the new sea level pressure parameter. You may notice that the pressure contours are no longer as smooth as they used to be. This is a consequence of the increase in resolution.